Performance
Speed and memory, measured. Every figure on this page is copied from a measurement artifact, and
each table names its source. The CPU tables have a committed machine-readable twin,
tests/results/benchmarks.json, and the GPU tables have one of their own,
tests/results/benchmarks-gpu.json: a GPU row is keyed by device and accumulation precision rather
than by thread count, so scripts/bench_gpu.sh sweeps and writes it separately and
benchmarks.md renders it as its own section of the raw report.
Environment
| CPU | AMD Ryzen Threadripper PRO 7995WX, 96 cores / 192 threads, AVX-512, 251 GB RAM |
| Build | gcc 13.3.0, -O3 -march=native, ggml 36da5713 (v0.22.0), GGML_LLAMAFILE=ON, kernel 6.17.0-1032-oem |
| GPU | 2 × NVIDIA RTX 4500 Ada Generation, 24 GB each, compute 8.9, 210 W board limit; every measurement has one card to itself and each table names which one |
| CUDA | runtime 13.0, nvcc 13.0.88, driver 580.173.02 |
| PyTorch (CPU) | torch 2.13.0+cpu, transformers 5.16.1, float32, 32 threads |
| PyTorch (GPU) | torch 2.13.0+cu130, transformers 5.16.1, attn_implementation="sdpa", TF32 off |
| TensorRT | 11.2.1.2 (tmp/venv-trt), engines built from opset-17 ONNX exports of the same modules |
| Date | 2026-08-31, idle box |
ms is the wall time of ggml_backend_graph_compute for one item — model load, graph build, the
host-side patchify and the output copy are excluded on both backends. On the CPU the full
jepa_encode call runs 0.3–0.8 ms above that up to 1024 tokens and 3.4–98.9 ms above it beyond,
dominated by the patchify and the output copy rather than by graph build. On a GPU the same two
stages become PCIe transfers and the gap is 3–14 %: 16.0 against 15.5 ms for I-JEPA at 256 tokens,
49.4 against 46.5 for the 16-frame ViT-L clip, and 349 against 306 for the 64-frame one, where 8 192
patch rows of 1 536 floats are built on the host and copied across.
Every GPU row is the best of 5 runs after 2 warmups, and the warmups are not a formality: ggml's CUDA backend captures a CUDA graph once it has seen the same topology and the same tensor addresses twice in a row, so from the third call the encoder is one graph launch instead of roughly 700 kernel launches. The first two calls of a process are materially slower, and that matters most on the small-N models where per-launch overhead is a real fraction of the forward.
CPU encoder
| model | shape | tokens | f32 t=32 | f16 t=32 | q8_0 t=32 | f16 t=96 | PyTorch t=32 | f16 speedup |
|---|---|---|---|---|---|---|---|---|
| I-JEPA ViT-H/14 | 224² | 256 | 174 | 147 | 129 | 113 | 250 | 1.70× (2.21× @96) |
| LeJEPA ViT-S/16 | 224² | 197 | 13.1 | 12.8 | 11.3 | – | 15.4 | 1.20× |
| LeWM ViT-Ti/14 | 224² | 257 | 9.2 | 9.8 | 9.1 | – | 16.8 ᶜ | 1.72× ᶜ |
| V-JEPA 2 ViT-L SSv2 | 16 f 256² | 2 048 | 943 | 823 | 793 | 564 | 1051 ᵃ | n/a ᵃ |
| V-JEPA 2 ViT-L fpc64 | 16 f 256² | 2 048 | 941 | 821 | 794 | 567 | 1293 ᵇ | n/a ᵇ |
| V-JEPA 2 ViT-L fpc64 | 64 f 256² | 8 192 | 7020 | 6388 | 6482 | 4027 | 10114 ᵇ | n/a ᵇ |
| V-JEPA 2.1 ViT-B/384 | 384² | 576 | 70.0 | 60.3 | 58.5 | 52.7 | 110 | 1.82× (2.09× @96) |
| V-JEPA 2.1 ViT-B/384 | 16 f 384² | 4 608 | 826 | 853 | 914 | 636 | 908 | 1.06× |
| V-JEPA 2.1 ViT-B/384 | 64 f 384² | 18 432 | 9050 | 9036 | 9487 | 5040 | – | – |
| LeVJEPA ViT-L/16 | 16 f 224² | 3 137 | 1512 | 1480 | 1508 | 882 | 1752 | 1.18× (1.99× @96) |
ᵃ the SSv2 reference forward is encoder + attentive pooler + classifier; the like-for-like comparison is the end-to-end table below. ᵇ the fpc64 reference forward always runs the predictor as well, so it is an upper bound and no speedup is claimed against it. ᶜ the LeWM reference forward is encode + projector + one 1-frame predictor call; the two extra graphs are ~1 ms of it, so this speedup is a slight over-estimate.
The PyTorch column is the mean over the reference samples of the same frame count, or the median after a cold first sample where that first sample is ≥ 1.2× the median of the rest (I-JEPA: 331.8 ms first against a steady 250; LeJEPA: 72.2 against 15.4).
Those samples are single-shot forwards, which is the noisier of the two ways to time a reference. parity.md divides by a warm loop instead — 1 warmup then 5 forwards on one clip — and for LeVJEPA the two differ by 8 %: 1752 ms here against 1904 ms median (1883 ms minimum) there, so the same f16 file reads 1.18× on this page and 1.2× on that one. The column keeps the single-shot rule so that every row divides by the same thing.
Source: benchmarks.md, tools/jepa-bench on synthetic deterministic input,
1 warmup + 3 measured runs, 32-thread sessions 2026-08-31 11:32 and 23:02 UTC and 96-thread sessions
11:44 and 23:05 UTC, all starting on an idle box; PyTorch column from the fixture manifests'
timing_s.forward_s. Machine-readable twin: tests/results/benchmarks.json.
GPU encoder
Optional build (-DJEPA_CUDA=ON, then --gpu [N]). Best of 5 runs after 2 warmups, GGML_PREC_F32
on every mul_mat. The CPU f16 t=32 column repeats the 32-thread f16 row of the
encoder table above, i.e. 96 Zen 4 cores' worth of machine against one workstation card.
GGML_PREC_F32 is what four of the six families ask for by default. hfvit (LeJEPA) and levjepa
default to f16 accumulation instead and are faster than their rows here by 1.11× and 1.06×:
Accumulation precision on a GPU is that decision, per family,
with the parity measurement that gates it.
| model | shape | tokens | f32 | f16 | q8_0 | q4_k | CPU f16 t=32 | f16 speed-up |
|---|---|---|---|---|---|---|---|---|
| I-JEPA ViT-H/14 | 224² | 256 | 11.8 | 15.5 | 8.0 | 7.8 | 147 | 9.5× |
| LeJEPA ViT-S/16 | 224² | 197 | – | 1.1 | – | – | 12.8 | 11.6× |
| LeWM ViT-Ti/14 | 224² | 257 | – | 0.9 | – | – | 9.8 | 11.5× |
| V-JEPA 2 ViT-L fpc64 | 16 f 256² | 2 048 | 44.3 | 46.5 | 34.4 | 34.8 | 821 | 17.6× |
| V-JEPA 2 ViT-L fpc64 | 64 f 256² | 8 192 | 303 | 306 | 281 | 282 | 6388 | 20.9× |
| V-JEPA 2.1 ViT-B/384 | 384² | 576 | – | 4.4 | – | 3.5 | 60.3 | 13.7× |
| V-JEPA 2.1 ViT-B/384 | 16 f 384² | 4 608 | – | 43.0 | – | 37.3 | 853 | 19.8× |
| V-JEPA 2.1 ViT-B/384 | 64 f 384² | 18 432 | – | 424 | – | – | 9036 | 21.3× |
| LeVJEPA ViT-L/16 | 16 f 224² | 3 137 | 85.4 | 87.2 | 70.8 | 71.2 | 1480 | 17.0× |
Against 96 CPU threads the same rows read 7.3× (I-JEPA), 12.2× and 13.2× (V-JEPA 2 ViT-L at 16 and 64 frames), 12.0×, 14.8× and 11.9× (V-JEPA 2.1 at 576, 4 608 and 18 432 tokens) and 10.1× (LeVJEPA).
The ratio grows with the sequence, and two effects separate the ends of it. The long clips keep the
card busy. The small image models are held back both by launch overhead — LeJEPA's whole forward is
1.1 ms — and, more than that, by GGML_PREC_F32, which costs 1.76× at I-JEPA's 256 tokens against
1.01× at 8 192; that is why the image models land at 9.5–13.7× rather than in the long clips'
twenties.
Source: tools/jepa-bench --gpu 0 on the box above, GGML_PREC_F32 on. Machine-readable twin:
tests/results/benchmarks-gpu.json, whose rows carry the run-to-run σ, the host peak RSS and the
32-thread CPU figure each speed-up divides; benchmarks.md prints them.
A fresh sweep of the whole grid on 2026-09-01 reproduces every cell in this table to within 1.7 %.
The one cell it moved is LeWM's, measured at 0.856 ms against the 0.8 this page rounded to before —
a 0.05 ms difference that is 7 % of a number this small, and its speed-up moved 12.3× → 11.5× with it.
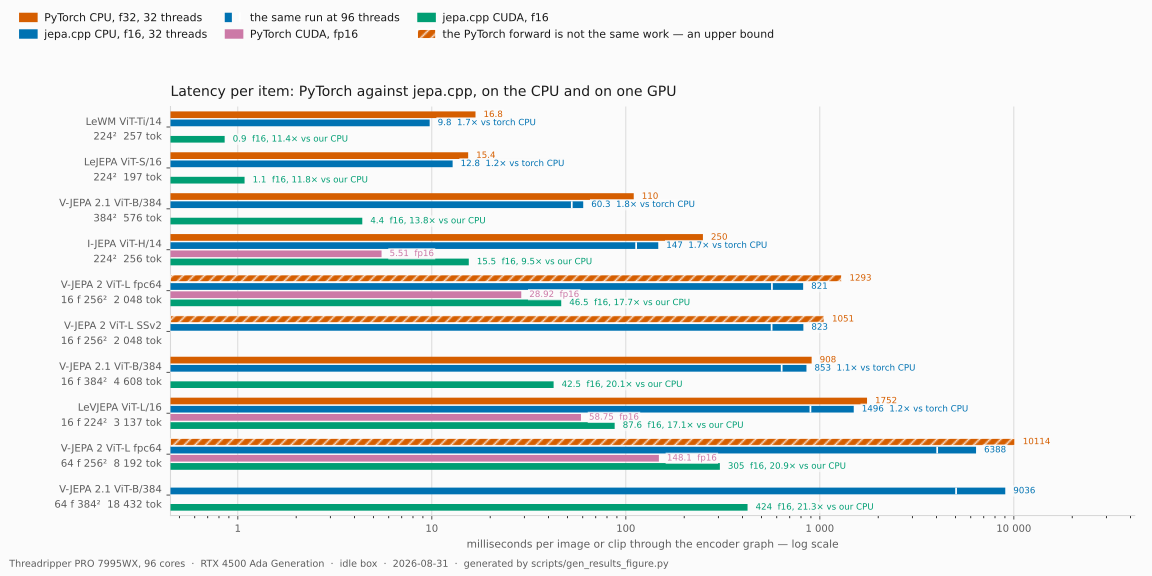
Both tables above in one picture: the bar is the millisecond, the white mark inside a jepa.cpp CPU
bar is the same run at 96 threads, and a hatched PyTorch bar is a forward that does more work than
ours, i.e. an upper bound. scripts/gen_results_figure.py --split redraws it.
Accumulation precision on a GPU
On CUDA an f16 weight's mul_mat can run two ways. With GGML_PREC_F32 ggml converts the weights to
F32 and hands cuBLAS a TF32 GEMM; without it cuBLAS gets its own f16 compute type and the reduction
accumulates in half. The first is 177× more accurate against the CPU (4.6e-03 → 2.6e-05 max relative
error) and it is the setting a GPU context marks its GEMMs with per family. Two measurements
decide each family, and neither is a judgement call:
- does the family still clear its GPU parity tier with f16 accumulation?
scripts/gpu_prec_sweep.shrunstest-parityover every fixture sample of every dtype at both settings. The tiers are unchanged — this measurement chooses which side of them a family lands on and never moves them. - is f16 accumulation faster at that family's shapes? Only f16 weights are affected at all: a
quantized file takes
mmqand never reaches cuBLAS, ggml's f32 path is TF32 regardless, and the flash-attention accumulator is set separately and is alwaysGGML_PREC_F32.
| family | file measured | shape | tokens | GGML_PREC_F32 ms |
f16 accumulation ms | ratio | GPU tier at f16 accumulation | default |
|---|---|---|---|---|---|---|---|---|
ijepa |
I-JEPA ViT-H/14 | 224² | 256 | 15.88 | 8.92 | 1.78× | fails | GGML_PREC_F32 |
hfvit |
LeJEPA ViT-S/16 | 224² | 197 | 1.13 | 1.02 | 1.11× | passes | f16 |
lewm |
LeWM ViT-Ti/14 | 224² | 257 | 0.87 | 0.88 | 0.98× ᵃ | passes | GGML_PREC_F32 |
vjepa2 |
V-JEPA 2 ViT-L/16 | 16 f 256² | 2 048 | 47.54 | 38.42 | 1.24× | fails | GGML_PREC_F32 |
vjepa2_1 |
V-JEPA 2.1 ViT-B/384 | 384² | 576 | 4.55 | 3.53 | 1.29× | passes | GGML_PREC_F32 ᵇ |
| 16 f 384² | 4 608 | 43.50 | 44.52 | 0.98× | passes | |||
| 64 f 384² | 18 432 | 431.5 | 447.9 | 0.96× | passes | |||
levjepa |
LeVJEPA ViT-L/16 | 16 f 224² | 3 137 | 89.85 | 84.72 | 1.06× | passes | f16 |
vjepa |
— | — | — | – | – | – | not measured ᶜ | GGML_PREC_F32 |
ᵃ the one row where f16 accumulation is the slower setting, consistently: three of the four F32
launches land at 0.850–0.853 ms against an f16 band of 0.878–0.881, and the fourth (0.910) is the
only overlap and the only outlier. On a 0.85 ms encode that is launch-bound rather than GEMM-bound
there is nothing to gain either way, so the family keeps the more accurate setting.
ᵇ its 576-token image shape is the largest single win in the table after I-JEPA's, and its clips —
the shapes this family exists for — are 2–4 % slower. A default is one value, and $JEPA_GPU_PREC=f16
turns the image case on for a deployment that only encodes images.
ᶜ V-JEPA v1 has no released weights and no fixtures, so it keeps the conservative setting.
The family where f16 accumulation pays most is the family the gate refuses. I-JEPA ViT-H's
256-token encode goes 15.9 → 8.9 ms with it, and its worst token drops to 0.8938 against the
image tier's 0.90 floor while rel_max reaches 0.2021 against a 0.15 bar — both on
coco_000000039769, both gated. V-JEPA 2 ViT-L is the same story one tier over: 1.24× for a
token-map mean of 0.9887 against 0.99 and rel_max 0.6953 against 0.5, on the bowling
clip. The SSv2 classifier built on the same encoder fails identically. Of the four families that do
pass, one gains 29 % at one shape and loses 2–4 % at the others, and the remaining three gain
between nothing and 11 %.
The two that flip gain little and lose nothing measurable: LeJEPA's token map moves from a mean of
0.999994 to 0.999988 and rel_max from 5.8e-03 to 6.3e-03, LeVJEPA's rel_max from 4.1e-03 to
1.6e-02 against a bar of 0.62 at 3 137 tokens, and their worst derived tensor stays at 0.999997 and
0.999999. Both flipped defaults are gated rather than only measured: the ctest entries
parity-lejepa-vits16-gpu and parity-levjepa-vitl16-gpu replay the golden dumps on device 0 with
no precision flag set, so a CUDA build's ctest judges the setting a caller actually gets
(parity.md). They SKIP with exit 0 on a build without
a GPU.
# the parity half — every family, every dtype, both settings
scripts/gpu_prec_sweep.sh 1 --timing-repeat 4

# the speed half, paired with each family's default row (and the batch rows of the next section)
SEL='^(ijepa_vith14_1k|lejepa-vits16-pretrain-in1k|lewm-pusht|vjepa2_1-vitb-384|levjepa-vitl16|vjepa2-vitl-fpc64-256)'
scripts/bench_gpu.sh 1 --merge --only "$SEL"' encoder ((T1|T16|T64) f16|T1 q8_0|T[0-9]+B[0-9]+ (f16|q8_0))$'

# either setting by hand, on any tool
JEPA_GPU_PREC=f16 build-cuda/jepa-embed -m models/gguf/ijepa_vith14_1k-f16.gguf --gpu 1 ...
build-cuda/jepa-bench -m models/gguf/ijepa_vith14_1k-f16.gguf --gpu 1 --gpu-prec f16 --md
Source: tests/results/gpu-prec.json — timing_repeatability for the millisecond columns (four
alternating launches of each setting, five measured runs inside each) and the per-file prec_f32 /
prec_f16 verdicts for the tier column. tests/results/benchmarks-gpu.json carries the same pairs
as single grid rows: it agrees to within 1.2 % on every shape above 5 ms and 2.5 % on the smaller
ones, with one exception — LeWM's f16 cell, 0.841 ms in the grid against 0.879 ms here, 4.6 % apart
on a sub-millisecond graph where a single launch is most of what is being measured. That is exactly
why the ratio column is read off four alternating launches rather than off one pair. Device 1.
Batched GPU throughput
jepa-bench --batch B puts B items through one graph on the batch dimension, so a row is one
ggml_backend_graph_compute and ms/item is it divided by B. What batching amortises is everything
that does not scale with the matmuls — kernel launches, the per-layer norm and activation passes,
weight streaming.
| model | dtype | ms/item b=1 | b=8 | b=32 | items/s b=1 | b=8 | b=32 |
|---|---|---|---|---|---|---|---|
| I-JEPA ViT-H/14, 224² | f16 | 16.08 | 10.33 | 11.20 | 62.2 | 96.8 | 89.3 |
| I-JEPA ViT-H/14, 224² | q8_0 | 8.12 | 6.00 | 9.03 | 123.2 | 166.6 | 110.7 |
| LeJEPA ViT-S/16, 224² | f16 | 0.993 | 0.411 | 0.419 | 1 007 | 2 432 | 2 384 |
| LeJEPA ViT-S/16, 224² | q8_0 | 1.289 | 0.400 | 0.342 | 776 | 2 498 | 2 926 |
| LeWM ViT-Ti/14, 224² | f16 | 0.854 | 0.249 | 0.199 | 1 171 | 4 020 | 5 014 |
| LeWM ViT-Ti/14, 224² | q8_0 | 1.094 | 0.252 | 0.203 | 914 | 3 968 | 4 929 |
| V-JEPA 2.1 ViT-B/384, 384² | f16 | 4.47 | 4.54 | 4.50 | 224 | 220 | 222 |
| V-JEPA 2.1 ViT-B/384, 384² | q8_0 | 3.45 | 3.47 | 3.48 | 290 | 288 | 288 |
The gain is inversely proportional to how full one item leaves the card. LeWM's 257-token ViT-Ti gains 4.3× and LeJEPA's ViT-S 2.4×, both launch-bound at under 1 ms per image; I-JEPA ViT-H gains 1.6× and then loses it again at B = 32; and V-JEPA 2.1 at 384² is flat to a per cent, because 576 tokens of a 12-layer 768-dim encoder already fill the GEMMs. B = 32 being worse than B = 8 on ViT-H is the same effect as on the CPU: the graph arena grows past what the weights leave of the caches.
Clips per batch do nothing. jepa_encode takes n_batch clips and the semantics are the
encoder's own, but a clip already fills the card:
| model | shape | ms/clip b=1 | b=8 |
|---|---|---|---|
| V-JEPA 2 ViT-L fpc64 | 16 f 256², 2 048 tokens | 47.02 | 47.64 |
| V-JEPA 2.1 ViT-B/384 | 16 f 384², 4 608 tokens | 43.38 | 43.63 |
Against PyTorch on the same card (scripts/torch_gpu_baseline.py --device 1 --batch 1,8,32
--compile, the fixture tensor repeated along the batch axis, torch.compile warmed up before
timing so its compilation is not in the milliseconds):
| model | runtime | ms/item b=1 | b=8 | b=32 | best items/s |
|---|---|---|---|---|---|
| I-JEPA ViT-H, torch fp16 | eager | 5.89 | 4.16 | 4.25 | 240 |
| I-JEPA ViT-H, torch fp16 | compile | 7.18 | 5.69 | 6.39 | 176 |
| I-JEPA ViT-H, jepa.cpp q8_0 | – | 8.12 | 6.00 | 9.03 | 167 |
| LeJEPA ViT-S, torch fp16 | eager | 2.23 | 0.302 | 0.259 | 3 859 |
| LeJEPA ViT-S, torch fp16 | compile | 0.920 | 0.238 | 0.212 | 4 712 |
| LeJEPA ViT-S, jepa.cpp q8_0 | – | 1.289 | 0.400 | 0.342 | 2 926 |
| V-JEPA 2 ViT-L 16 f, torch fp16 | eager | 30.30 | 30.09 | – | 33.2 |
| V-JEPA 2 ViT-L 16 f, torch fp16 | compile | 24.34 | 24.06 | – | 41.6 |
| V-JEPA 2 ViT-L 16 f, jepa.cpp q8_0 | – | 33.9 ᵍ | – | – | 29.5 |
PyTorch keeps the throughput crown on this card and torch.compile widens it — except on I-JEPA,
where it costs 22–50 %. Batched, jepa.cpp reaches 69 % of torch-fp16-eager's image throughput
on ViT-H and 62 % of torch.compile's on ViT-S, against the 36–67 % the batch-1 table below
reports; batching closes part of the gap and none of it is closed by the kernels. torch.compile
helps most where a graph is small enough for launch overhead to dominate (LeJEPA at b = 1: 2.23 →
0.92 ms) and least where it already is not.
ᵍ the q8_0 clip row is the CUDA0 sweep's, the only card it was measured on; the batch axis was not swept for it because clip batching is flat.
A multi-stream option is not worth adding, and the reason is measured. ggml gives a context one
CUDA stream, so the question is whether independent graphs on one device beat one graph: four
concurrent encoder processes reach 1.39× of one process on LeJEPA and 0.95× on I-JEPA. Where
concurrency wins, --batch 32 in a single process already delivers 2 384 items/s against
concurrency's 1 412 — batching covers the case a second stream would serve, in one graph and one
allocation.
build-cuda/jepa-bench -m models/gguf/ijepa_vith14_1k-q8_0.gguf --gpu 1 --batch 8 --md
tmp/venv-cuda/bin/python scripts/torch_gpu_baseline.py --device 1 --batch 1,8,32 --compile \
    --max-batch-tokens 32768 -o tmp/bench-gpu/torch-gpu-batched.json
Source: benchmarks.md and its
PyTorch counterpart, both rendered from tests/results/benchmarks-gpu.json (batch and
pytorch_gpu_batched). The concurrency rows are the concurrency section of
tests/results/gpu-profile.json. Device 1 throughout.
Where the GPU time goes
nsys around one jepa-bench process, kernels grouped by (name, launch grid) and attributed to a
graph op by launch count — a 24-layer encoder timed over 7 passes runs its per-layer roll exactly
24 × 2 × 7 = 336 times, and nothing else in the graph rolls. Device-to-device memcpys count as GPU
time, because ggml serves a contiguous GGML_OP_CONT with cudaMemcpyAsync.
| case | tokens | GPU ms/pass | flash attention | 3-D RoPE + its cont |
the rest |
|---|---|---|---|---|---|
| I-JEPA ViT-H/14, 224² | 256 | 16.0 | 3.4 % | — (no RoPE) | 96.6 % |
| V-JEPA 2 ViT-L, 16 f | 2 048 | 47.0 | 14.0 % | 10.4 % | 75.6 % |
| V-JEPA 2 ViT-L, 64 f | 8 192 | 308.6 | 30.6 % | 13.9 % | 55.5 % |
| LeVJEPA ViT-L/16, 16 f | 3 137 | 83.8 | 25.4 % | 10.6 % | 64.0 % |
RoPE is five graph nodes doing one tensor's worth of arithmetic in six passes over memory —
a cont, a roll, two broadcast muls and an add, once for q and once for k in every block. At
2 048 tokens that is 4.91 ms of a 47 ms encode: roll 1.89, the two muls 1.42, the add 1.03 and
the cont 0.57. A single fused kernel would read the strided q view and the two tables once and
write the result once, which is about a fifth of the traffic, so the prize is roughly 4 ms of the
ViT-L encode and 34 ms of the 64-frame one.
That kernel cannot be written inside this repository. ggml has no fused multiply-add over three
operands and no rotary op the V-JEPA 2 variant fits — its cos/sin tables are tiled rather than
interleaved, so the two members of a rotated pair use different frequencies and the transform is not
a rotation (parity.md, src/rope3d.h). A fused RoPE would therefore be a new CUDA
kernel in ggml/, which is a pinned submodule this project builds unmodified and whose commit every
artifact records. The measurement stands as the case for taking that step; the step itself is not
one a change to jepa.cpp can make.
The image encoder's profile is the control and says something else: with no RoPE and only 3.4 % in
attention, 42.5 % of I-JEPA's GPU time is convert_unary<half, float> — ggml converting the f16
weights to F32 for the TF32 GEMM that GGML_PREC_F32 asks for, once per mul_mat, in three launch
shapes for the three widths of the block. That is the same cost the
accumulation-precision table prices at 1.78×, seen from the
other side, and it is why the win is largest exactly where the gate refuses it.
Attention tiling at off-stride token counts
CUDA flash attention walks the key axis in tiles of FATTN_KQ_STRIDE = 256, and a model with a CLS
row lands on a multiple of it only if frames × h × w is odd — which no shape in this model zoo is,
since every patch grid here has an even side. LeVJEPA's 3 137 needs 13 tiles for 12.25 tiles' worth
of keys. The same encoder at crops that straddle the stride says what that costs:
| tokens | multiple of 256 | tiles | padded to | flash ms/pass | ns per score element per layer |
|---|---|---|---|---|---|
| 1 792 | yes | 7 | 1 792 | 4.98 | 0.0646 |
| 1 920 | no | 8 | 2 048 | 5.76 | 0.0651 |
| 2 048 | yes | 8 | 2 048 | 6.51 | 0.0647 |
| 2 176 | no | 9 | 2 304 | 7.36 | 0.0648 |
| 2 304 | yes | 9 | 2 304 | 8.24 | 0.0647 |
Nothing — there is no step at the boundary. The cost per score element sits at 0.0646–0.0651 ns across all five counts within this sweep, and about 2 % across sweeps; either way the off-stride counts are no dearer than the aligned ones on either side of them, while the cost per padded element falls for exactly the off-stride counts (0.0610–0.0612 against 0.0646–0.0647). The kernel clamps its last tile against the real key count instead of computing it, so an off-stride sequence pays for the keys it has and not for the tile it does not fill. No tiling kernel is called for.
One thing the same source does show: the tile-skipping optimisation ggml applies to a masked
attention — flash_attn_mask_to_KV_max, which finds the last unmasked key per query tile and stops
there — is gated on K->ne[1] % FATTN_KQ_STRIDE == 0 and is therefore unreachable for a CLS model.
LeVJEPA pays 0.0902 ns per score element against the unmasked encoder's 0.0647, and
46.9 % of its score matrix is closed. Padding K, V and the
mask up to the stride with fully masked rows would make the optimisation reachable from inside
jepa.cpp; that is a change to a parity-gated attention path and is not made here.
Source: tests/results/gpu-profile.json, scripts/profile_gpu.py --device 1. The per-kernel rows,
their launch counts and the arithmetic behind every attribution are in the artifact.
The TensorRT ceiling
TensorRT is not jepa.cpp. It is NVIDIA's own compiler for NVIDIA hardware: it fuses the graph, autotunes kernels against the card in front of it and emits one engine. Nothing portable should be expected to match it, which is why it is the right thing to measure — it says how much of this card an encoder can be made to use at all.
| encoder | shape | tokens | TensorRT fp16 | TensorRT fp32 | torch fp16 | jepa.cpp default | jepa.cpp best |
|---|---|---|---|---|---|---|---|
| I-JEPA ViT-H/14 | 224² | 256 | 4.98 | 11.71 | 5.89 | 16.08 (f16) | 8.12 (q8_0) |
| V-JEPA 2 ViT-L fpc64 | 16 f 256² | 2 048 | – ʰ | 100.0 | 30.30 | 47.02 (f16) | 33.9 (q8_0, CUDA0) |
Read the fp16 column beside its own accuracy. The I-JEPA engine reproduces the fixture's PyTorch dump to a mean per-token cosine of 0.994–0.996 — 0.9944 for the engine timed here, and it moves between builds because TensorRT autotunes its kernel choice against the card each time; jepa.cpp scores 0.999986 on the same sample and the image family's GPU f16 tier demands a mean of 0.999, which neither end of that range clears. The fp32 engine reaches 0.99998 and costs 11.7 ms — slower than jepa.cpp's q8_0 path. The ceiling is real and it is 1.6–3.2× above where jepa.cpp sits, but part of the distance is numerical and the tiers on this project's own files say how much.
The V-JEPA 2 fp32 engine is the other surprise: 100.0 ms against jepa.cpp's 47.0. A true-fp32 video encoder is not the configuration anyone would deploy, and it is not one jepa.cpp offers either (ggml's f32 CUDA path is TF32) — the row is here because it is the only precision the export survives, and it makes the point that a compiler is not automatically faster at a precision nobody tunes for.
ʰ V-JEPA 2 has no fp16 engine. torch.onnx.export of a half module fails outright (tensor does not
have a device), and converting the fp32 graph leaves the Conv3d patch embedding with a float input
against a half kernel, which TensorRT 11's strongly-typed parser rejects. The artifact records the
parser's message verbatim.
uv venv tmp/venv-trt && VIRTUAL_ENV=tmp/venv-trt uv pip install tensorrt onnx onnxconverter-common cuda-python
tmp/venv-cuda/bin/python scripts/tensorrt_baseline.py export  --out-dir tmp/trt
tmp/venv-trt/bin/python  scripts/tensorrt_baseline.py convert --out-dir tmp/trt
tmp/venv-trt/bin/python  scripts/tensorrt_baseline.py run --device 1 --dtype fp16 --merge \
    --out-dir tmp/trt -o tests/results/tensorrt.json
Source: tests/results/tensorrt.json (TensorRT 11.2.1.2, engine built per row, 3 warmup + 7 timed
executions with a stream synchronise around each, the H2D and D2H copies outside the timed region,
and output_cos_vs_reference per row); the torch column is pytorch_gpu_batched and the jepa.cpp
columns the rows of tests/results/benchmarks-gpu.json. Device 1 except the CUDA0 cell named as
such.
Predictor, head and world model on a GPU
These graphs are not encoder rows and do not share the encoder table's harness, so they are reported with their own shapes and sources.
| graph | shape | CUDA f16 | CPU f16 t=32 | ratio |
|---|---|---|---|---|
| V-JEPA 2 ViT-L masked predictor, archery | 4 096 rows (2 048 context + 2 048 mask) | 154 | 452 | 2.9× |
| V-JEPA 2 ViT-L masked predictor, bowling | 4 096 rows | 113 | 326 | 2.9× |
| SSv2 attentive-pool head | 2 048 tokens | 5.7 | 96 ᵈ | 16.8× |
LeWM predictor, pred_next |
1 row | 0.41 | 0.65 | 1.6× |
LeWM predictor, pred_seq |
3 rows | 3.22 | 1.22 | 0.4× — slower on the GPU |
The masked-predictor and LeWM rows come from test-predictor on the same fixture clips — the CUDA
column the median of three launches, the CPU column one run — so each line is like-for-like;
archery carries the first-touch page-in of its run, which is why bowling is faster at the same
shape on both backends.
The masked predictor gains 2.9×, where the ViT-L encoder on the very same clip gains 17.6×,
and that is the price of the naive attention path it takes at head_dim 32 — accurate, genuinely
F32, and ~3 TFLOP/s against flash's 50–70. The LeWM predictor is the one graph that is slower on a GPU at its real shape: three
rows of 192 dimensions is far below the size at which a launch pays for itself.
ᵈ 96 ms is jepa-classify --time on the fixture clip; the synthetic head mode of jepa-bench
measures the same graph at 99.0 ms (see the end-to-end table below). jepa-bench --mode lewm-step
likewise reads 0.918 ms for the full 3-frame window against test-predictor's 1.22 ms, on synthetic
rather than reference state; on the card the same two read 0.45 and 3.22 ms.
Source: parity.md and
parity.md for
the predictor and LeWM rows, whose GPU column was re-measured with the 2026-09-01 sweep (median of
three test-predictor --gpu 0 launches per file); jepa-bench --gpu 0 for the head row, which is a
row of tests/results/benchmarks-gpu.json, and jepa-classify --time for its CPU cell.
V-JEPA 2 ViT-g/16 and V-JEPA 2-AC (2026-09-01, device 1)
These rows were measured on the second card of the same box, not device 0 like the tables above (the
display hangs off device 0 and the machine was in use). The two cards are the same model, so the
numbers are comparable, but they are not from the same sweep and are kept separate for that reason.
jepa-bench --gpu 1, 5 measured runs after 2 warmups, GGML_PREC_F32. The CPU column is the same
binary at -t 32 on the idle box (3 runs after 1 warmup, Tctl 52 → 84 °C over the pass), and the
PyTorch column is the float32 forward the reference dump recorded at 32 threads
(tests/fixtures/ref/*/manifest.json, timing_s.forward_s).
Which statistic: every jepa-bench figure on this page is the mean of the measured runs (its
headline column; the minimum is printed beside it in parentheses), while
scripts/torch_ac_baseline.py and scripts/torch_gpu_baseline.py report the minimum. On an idle
card the two differ by about 0.1 % — the K = 64, H = 2 rollout row of
tests/results/benchmarks-gpu.json reads 787.574 ms mean against 786.909 min — so the comparison
stands, but the columns are not the same estimator and a loaded box would separate them.
| model | mode | shape | GPU f32 | GPU f16 | GPU q8_0 | GPU q4_k | CPU f16 t=32 | PyTorch f32 t=32 | GPU f16 speed-up |
|---|---|---|---|---|---|---|---|---|---|
| V-JEPA 2 ViT-g/16 | encoder | 16 f 256² (2 048 tok) | 133.2 | 142.8 | 101.7 | 100.7 | 2 364 | 2 704 | 16.5× |
| V-JEPA 2 ViT-g/16 | encoder | 64 f 256² (8 192 tok) | 889.6 | 905.1 | 831.2 | 832.3 | 16 185 | 18 802 | 17.9× |
| V-JEPA 2 ViT-g/16 | masked predictor | 4 096 rows | – | 112.2 | – | – | 356 | – | 3.2× |
| V-JEPA 2-AC ViT-g | encoder | 2 f 256² (256 tok) | – | 27.7 | 14.0 | 13.4 | 250 | 517 | 9.0× |
Three things worth naming.
The ViT-g is the first model here where f16 is slower than f32 on the GPU (142.8 vs 133.2 ms at
2 048 tokens): with GGML_PREC_F32 forced, an f16 weight buys no arithmetic and costs an up-convert,
and at 1408 dims the up-convert is no longer free. The quantized files are the fastest, as everywhere
else — they never reach cuBLAS.
On the CPU the ViT-g lead over PyTorch is the narrowest in the project — 1.14× at 2 048 tokens and 1.16× at 8 192, against 1.4–2.6× for the smaller video models. At a billion parameters both engines are memory-bandwidth-bound on the same weights, and there is nothing left for a better kernel to win. The GPU is the platform for this encoder: 16 s per 64-frame clip on 32 Zen 4 cores against 0.9 s on one workstation card.
The AC encoder is 9× faster on the card and only 250 ms on the CPU, because a world-model encode is one 2-frame clip — 256 tokens, one tubelet — not a 64-frame one. Encoding is not the bottleneck of planning; the predictor is, and it is the next table.
The planning shapes: jepa_ac_predict and jepa_ac_rollout vs PyTorch on the same card
The action-conditioned predictor is what a planner runs thousands of times against one encode, so
the axis that matters is K, the candidate count on the graph's batch axis. H = 2 is the
reference planner's horizon (mpc_args["rollout"]). jepa.cpp is f16, PyTorch is float32 — Meta's
ACRoPEAttention cannot run in pure float16 (its RoPE promotes q/k to float32 while v stays half, and
scaled_dot_product_attention rejects the mix), so float32 is the only PyTorch baseline there is.
scripts/torch_ac_baseline.py, same protocol: best of 5 after 2 warmups with cuda.synchronize().
| graph | K | GPU f16 | per candidate | PyTorch f32, same card | per candidate | GPU speed-up | CPU f16 t=32 | per candidate |
|---|---|---|---|---|---|---|---|---|
jepa_ac_predict, 1 context frame |
1 | 8.96 | 8.96 | 45.07 | 45.07 | 5.0× | 93.8 | 93.8 |
| 16 | 112.7 | 7.04 | 188.8 | 11.80 | 1.68× | 1 265 | 79.1 | |
| 64 | 531.8 | 8.31 | 827.5 | 12.93 | 1.56× | 5 202 | 81.3 | |
jepa_ac_rollout, H = 2 (ms per step) |
1 | 11.68 | 11.68 | 45.54 | 45.54 | 3.9× | 133.9 | 133.9 |
| 16 | 177.2 | 11.07 | 293.1 | 18.32 | 1.65× | 1 978 | 123.6 | |
| 64 | 791.2 | 12.36 | 1289.5 | 20.15 | 1.63× | 8 119 | 126.9 |
Three things the shape of that table says. Batching K candidates is what makes planning affordable: one candidate costs 8.96 ms on its own and 7.04 ms when 16 share the graph, because the predictor is 256 rows per candidate — far too few to fill the card alone. The CPU shows the same effect more sharply (93.8 → 79.1 ms per candidate) and then flattens, since 32 cores saturate at K = 16 already. The GPU lead over PyTorch narrows as K grows (5.0× at K = 1, 1.6× at K = 64): at K = 1 jepa.cpp wins on launch overhead, and by K = 64 both implementations are simply doing the same GEMMs. And a rollout step costs more than a bare predictor call at the same K because its context has grown by a frame, so the sequence is 516 rows instead of 258.
Read as a planner's budget: one CEM iteration of 64 candidates over a 2-step horizon is 1.6 s on the card (2 × 791 ms) and 16 s on 32 CPU cores. The CPU is where you develop; the card is where you plan.
# the exact rows above
build-cuda/jepa-bench -m models/gguf/vjepa2-ac-vitg-f16.gguf --mode ac         --batch 64 --gpu 1
build-cuda/jepa-bench -m models/gguf/vjepa2-ac-vitg-f16.gguf --mode ac-rollout --batch 64 --steps 2 --gpu 1
build/jepa-bench      -m models/gguf/vjepa2-ac-vitg-f16.gguf --mode ac-rollout --batch 64 --steps 2 -t 32 \
    --repeat 3 --warmup 1
tmp/venv-cuda/bin/python scripts/torch_ac_baseline.py --device cuda:1 --candidates 1,16,64 --horizon 2
These rows are hand-measured with jepa-bench rather than taken from
tests/results/benchmarks{,-gpu}.json: tmp/bench/ was empty in this checkout, and
gen_benchmarks_md.py rebuilds the committed artifacts from the sweep directory alone, so a partial
run would have truncated every other model's CPU rows. The grid entries that make a future full sweep
pick these shapes up are in scripts/bench_gpu.grid and the pred_kind = ac arm of
scripts/bench_all.sh.
Planning: what a CEM decision costs
The KPI for a world model is not a forward pass, it is a decision: one CEM iteration scores K
candidate action sequences over an H-step horizon, and a planner runs several iterations per
observation. jepa-bench --mode ac-plan times exactly that (jepa_ac_plan, ms per iteration);
--mode ac-rollout times the rollout underneath it (ms per horizon step). Device 1, GGML_PREC_F32,
mean of 5 runs after 2 warmups. Every cell here is a row of
tests/results/benchmarks-gpu.json
— ms_mean for the matching model/mode/ftype/batch/shape.
| K = 16 | K = 64 | K = 256 | |
|---|---|---|---|
| rollout, ms per step (f16, H = 2) | 176.0 | 787.6 | 3 173.2 |
| rollout, ms per step (f16, H = 4) | 321.0 | 1 341.1 | – ᵃ |
| — per candidate-step, H = 2 / H = 4 | 11.0 / 20.1 | 12.3 / 21.0 | 12.4 / – |
| rollout, ms per step (q8_0, H = 2 / H = 4) | 144.0 / 283.8 | 750.7 / 1 331.6 | – |
| one CEM iteration, ms (f16, H = 2) | 358.0 | 1 590.4 | 6 371.0 |
| one CEM iteration, ms (f16, H = 4) | 1 285.9 | 5 369.0 | – ᵃ |
| one CEM iteration, ms (q8_0, H = 2) | 290.9 | 1 503.8 | – |
| peak VRAM, whole process (f16, H = 2) | 3 131 MiB | 3 955 MiB | 7 315 MiB |
ᵃ K = 256 with H = 4 is refused by the default $JEPA_MAX_GRAPH_MIB (8 GiB): the last step is 3
frames × 256 candidates = 774 rows of graph, and the library reports 11 611.1 MiB of estimated
graph memory. It runs at JEPA_MAX_GRAPH_MIB=16384 in 11 133 MiB of VRAM, so it fits on a 24 GiB
card but not inside the library's default ceiling — the guard is doing its job, and raising it is a
deliberate act. The VRAM row is nvidia-smi sampled at 5 Hz for the whole process (weights included),
not a jepa-bench column.
Throughput is flat in K, which is the whole point. A "rollout" is one candidate carried through H steps: at H = 2 that is 40.6 rollouts/s at K = 64 and 40.3 at K = 256 — the candidates share one graph per step, so the card stays saturated and the per-candidate cost stops improving after about K = 16 (11.0 → 12.4 ms per candidate-step). Doubling K doubles the wall time and doubles the candidates scored; it does not get cheaper, and it does not get worse.
Against PyTorch on the same card (scripts/torch_ac_baseline.py --cem, Meta's predictor, float32
— their ACRoPEAttention cannot run in pure float16, see the note above; minimum of 5 runs):
| one CEM iteration, H = 2 | jepa.cpp f16 | PyTorch f32 | speed-up |
|---|---|---|---|
| K = 16 | 358.0 | 599.7 | 1.68× |
| K = 64 | 1 590.4 | 2 619.3 | 1.65× |
On the CPU (32 threads, idle box) the same rollout at K = 64, H = 2 costs 8 243 ms per step at f16 — 129 ms per candidate-step against the card's 12.3, a factor 10.5. A planner is a GPU workload; the CPU path is for development and for the single-candidate case. The full CPU grid is in benchmarks.
The cached context does not appear in these numbers, and that is the finding. Measured
back-to-back in one session, same binary, --no-cached (the explicit-context entry point, which
uploads the observed frames and replicates them across the candidates every step) against the default:
| K=16 H=2 | K=64 H=2 | K=256 H=2 | K=16 H=4 | K=64 H=4 | |
|---|---|---|---|---|---|
| cached, ms/step | 177.51 | 793.09 | 3 183.48 | 322.06 | 1 342.90 |
| explicit, ms/step | 177.70 | 793.66 | 3 188.07 | 321.49 | 1 340.19 |
| delta | +0.11 % | +0.07 % | +0.14 % | −0.18 % | −0.20 % |
±0.2 %, straddling zero — the two code paths are indistinguishable. pred.embed is one
[1408 → 1024] matmul over 256 rows against 24 blocks over K × 258 rows, and the upload is 1.44 MB
against a half-second graph. The handle is an API for holding a context across iterations and
observations, not a throughput optimisation;
architecture says so with the rest of the numbers.
(These five pairs are a controlled comparison, not grid rows: bench_gpu.sh only ever measures the
default path, so the artifact carries the cached numbers alone.)
build-cuda/jepa-bench -m models/gguf/vjepa2-ac-vitg-f16.gguf --mode ac-plan --batch 64 --steps 2 --gpu 1
build-cuda/jepa-bench -m models/gguf/vjepa2-ac-vitg-f16.gguf --mode ac-rollout --batch 256 --steps 2 --gpu 1
build-cuda/jepa-bench -m models/gguf/vjepa2-ac-vitg-f16.gguf --mode ac-rollout --batch 64 --steps 2 --no-cached --gpu 1
JEPA_MAX_GRAPH_MIB=16384 build-cuda/jepa-bench -m models/gguf/vjepa2-ac-vitg-f16.gguf \
    --mode ac-rollout --batch 256 --steps 4 --gpu 1
tmp/venv-cuda/bin/python scripts/torch_ac_baseline.py --device cuda:1 --candidates 16,64 --horizon 2 --cem
H-JEPA: what one planner call costs
One jepa_hjepa_plan call (tools/jepa-plan) at the settings of the authors' eval configs, at the horizons of an
episode's first call, f16 files, wall time in seconds, best of 2. Samples, horizons and iterations are listed level 1
first; every level may run up to 90 iterations and stops early when its best cost stalls.
tests/results/hjepa-plan-timing.json, written by scripts/hjepa_batch.py time on the AMD Ryzen Threadripper PRO 7995WX 96-Cores.
| preset | samples | horizons | iterations run | 8 threads | 32 threads | 96 threads |
|---|---|---|---|---|---|---|
AntMaze, 3 levels (ant_l3) |
100 / 100 / 400 | 2 / 2 / 5 | 79 / 32 / 37 | 16.5 | 5.3 | 3.0 |
Push-T, 2 levels (pusht_l2) |
50 / 400 | 2 / 8 | 30 / 42 | 25.2 | 8.1 | 4.7 |
DROID, 2 levels (droid_l2) |
16 / 4 | 36 / 12 | 90 / 58 | 51.4 | 43.2 | 43.2 |
Push-T, flat LeWM (pusht_flat) |
800 | 15 | 36 | 33.3 | 10.9 | 7.3 |
The planner's gradient is computed on the host, one tape per small group of candidates, so it scales with min(threads, candidates): the DROID preset optimises 16 and 4 candidates through a 12-layer predictor over 36 steps and has nothing for the other 80 threads to do. The result is the same bytes at every thread count. An episode calls the planner once per replanning interval — 35 times for the 350-step AntMaze evaluation — with horizons that shrink as the budget runs out, so later calls are cheaper than the first.
GPU against PyTorch on the same card
VJEPA2Model(skip_predictor=True) / IJepaModel / LeVJEPAModel, 3 warmup + 7 timed forwards with
cuda.synchronize() around each.
| shape | jepa.cpp CPU t=32 | jepa.cpp CUDA | with --gpu-prec f16 |
torch fp16 | torch fp32 | ggml / torch fp16 |
|---|---|---|---|---|---|---|
| I-JEPA ViT-H, 224² | 147.0 | 15.5 | 8.8 | 5.51 | 24.26 | 2.8× / 1.6× |
| V-JEPA 2 ViT-L, 16 f | 820.7 | 46.5 | 37.4 | 28.74 | 115.62 | 1.6× / 1.3× |
| V-JEPA 2 ViT-L, 64 f | 6388.1 | 306 | 304 | 147.5 | 838.38 | 2.1× / 2.1× |
| LeVJEPA ViT-L, 16 f | 1480 | 87.2 | 82.9 | 58.51 | 222.64 | 1.5× / 1.4× |
jepa.cpp-CUDA lands at 36–67 % of PyTorch's throughput on the same GPU at the precision this
table was measured with and 49–77 % with --gpu-prec f16, while being 9–21× faster than the CPU
engine. LeVJEPA is the closest of the four (67 % / 71 %), and the mask is why: its explicit attention
mask disqualifies PyTorch's flash SDPA kernel, which its own model card warns about, so the reference
gives up more than jepa.cpp does.
The jepa.cpp CUDA column is GGML_PREC_F32, which was the default for every family when this
sweep ran. It still is for ijepa and vjepa2, the first three rows; LeVJEPA now defaults to f16
accumulation, so its shipping figure on this card is 83.2 ms — the levjepa-vitl16 f16 row of
tests/results/benchmarks-gpu.json with device CUDA0 and gpu_prec f16, which the fourth column
above rounds to 82.9 from the earlier session — and the 71 % beside it.
Accumulation precision on a GPU measures the same pair again on
device 1 (89.85 → 84.72 ms) and carries the parity result behind the change.
For scale, the card's own ceilings computed from what nvidia-smi reports — 7 680 CUDA cores at a
max SM clock of 3 105 MHz under a 210 W board limit — are 47.7 TFLOP/s FP32 and, at the 2× dense
rate of Ada's 4th-generation tensor cores, ~95 TFLOP/s FP16 with FP32 accumulate. Sustained
clocks under that power cap are lower, so both are upper bounds; PyTorch reaches 56–77 TFLOP/s at
fp16 and ~14 TFLOP/s at fp32 on this card, which is the practical ceiling to read the percentages
against.
The remaining gap is everything that is neither a GEMM nor an attention: 48 unfused LayerNorms per
ViT-L forward (ggml-CUDA fuses {RMS_NORM, MUL, ADD} but has no {NORM, MUL, ADD} pattern, and ViTs
use LayerNorm), gelu_erf over the FFN hidden twice per layer, and the per-layer F32→F16 K/V casts.
At the 64-frame shape the component rates account for 182 ms of the 306 measured.
Memory on the card: torch's fp16 peak GPU memory is 1.19 GiB (I-JEPA at 256 tokens), 0.67 GiB
(ViT-L at 2 048) and 0.68 GiB (LeVJEPA at 3 137, of which the 3137² F16 mask is 20 MiB), against
0.83 GiB at 8 192. Each is max_memory_allocated after the warmups with one model per precision on
the device, so it is that precision's own footprint and nothing else.
Source: scripts/torch_gpu_baseline.py --device 0, recorded under pytorch_gpu in
tests/results/benchmarks-gpu.json and printed in
benchmarks.md. The 2026-09-01 re-run reproduces every
timing on this page to within 2 % except the two I-JEPA rows, the smallest forward of the four:
fp16 reads 5.51 ms (mean over 7 forwards, σ 0.04, minimum 5.46) against the 5.91 ms this page used
to quote — a row whose earlier σ was 0.34 ms at that scale, so the tighter figure replaces it — and
fp32 reads 23.39 ms against 24.26, which is inside the 5 % this page treats as reproduction and is
kept. The LeVJEPA fp16 peak moved from 1.15 GiB for a reason of method rather than machine: the
earlier session reused one module for both precisions, so its fp16 peak still carried the fp32 copy
of the weights.
End-to-end video classification
V-JEPA 2 ViT-L SSv2, 16-frame 256² clip, 2 048 tokens. The reference forward here is
VJEPA2ForVideoClassification — encoder + attentive pooler + classifier with the predictor skipped —
so this comparison is like-for-like.
| ftype | threads | encoder ms | head ms | total ms | PyTorch ms | speedup |
|---|---|---|---|---|---|---|
| f32 | 32 | 943 | 107 | 1050 | 1051 | 1.00× |
| f16 | 32 | 823 | 99.0 | 922 | 1051 | 1.14× |
| f16 | 96 | 564 | 67.1 | 631 | 1051 | 1.66× |
| q8_0 | 32 | 793 | 98.2 | 891 | 1051 | 1.18× |
Source: benchmarks.md.
Predictors and world model
Predictor worst case: context = target = every token, i.e. 2 × tokens through the 12-layer 384-d predictor.
| model | tokens | f32 t=32 | f16 t=32 | q8_0 t=32 | f16 t=96 |
|---|---|---|---|---|---|
| V-JEPA 2 ViT-L SSv2 | 2 048 | 333.1 | 340.8 | 336.8 | 208.0 |
| V-JEPA 2 ViT-L fpc64 | 2 048 | 338.3 | 343.8 | 332.7 | 207.4 |
| V-JEPA 2.1 ViT-B/384 | 4 608 | 1296.7 | 1303.6 | 1272.6 | 854.4 |
On the real fixture clips the same 2 048-token V-JEPA 2 predictor runs 452 / 326 ms at f16 against a PyTorch predictor call of 2524 ms — ~5.6× — and costs 40–55 % of the encoder pass on the same clip.
The LeWM Push-T world model (D = 192, 3-frame causal window) is launch-bound: one full-window
jepa_lewm_predict takes 0.911 / 0.918 / 0.739 ms at f32 / f16 / q8_0, and jepa_lewm_rollout runs
0.817 / 0.865 / 0.744 ms per step — 1225 / 1156 / 1344 steps per second, encoder excluded.
Source: benchmarks.md and benchmarks.md; the fixture-clip predictor timings from parity.md.
Batched image encoding
ms is jepa-bench --batch B on synthetic input; img/s is jepa-embed over 561 Imagenette-160
validation JPEGs with decode, preprocessing and one GGUF load inside the number, best of two passes.
| model | dtype | ms/image b=1 | b=8 | b=32 | img/s b=1 → 8 → 32 | PyTorch batch 32 | peak RSS b=1 → 32 |
|---|---|---|---|---|---|---|---|
| LeJEPA ViT-S/16 | f16 | 12.6 | 8.1 | 7.4 | 67.0 → 94.4 → 94.5 | 86.4–89.2 | 52 → 148 MiB |
| LeWM ViT-Ti/14 | f16 | 9.7 | 4.8 | 4.4 | 95.4 → 148.5 → 159.0 | 189.7–206.2 | 48 → 107 MiB |
| I-JEPA ViT-H/14 | f16 | 148.8 | 137.9 | 140.3 | 6.16 → 6.92 → 6.77 | 5.45–5.51 | 1230 → 1597 MiB |
| I-JEPA ViT-H/14 | q8_0 | 139.4 | 129.8 | 129.8 | 6.94 → 7.60 → 7.38 | 5.45–5.51 | 659 → 993 MiB |
The PyTorch baseline is f32 in every row.
The win is inversely proportional to model size. Batching amortises what does not scale with the matmuls — thread launch, the per-layer norm and GELU passes, weight streaming — so the two small models gain 1.7× and 2.2× of encoder time while ViT-H, whose 1.2 GiB of weights already keep 32 threads busy on one image, gains 1.08×. B = 32 is also worse than B = 8 there (140.3 against 137.9 ms): peak RSS grows to 1.6 GiB — 1.2 GiB of weights plus a graph arena that has gone from ~24 MiB at B = 1 to ~391 MiB — and the weights stop fitting alongside it in cache. LeJEPA passes PyTorch's batch-32 throughput, LeWM reaches 0.77–0.84× of it, and video is not batched.
Source: tests/results/batching.json, 32 threads, every timed pass run alone;
accuracy-image.md
has the per-split throughput rows.
Memory
| model | f32 | f16 | q8_0 | q4_k | peak RSS, f16 at its largest shape |
|---|---|---|---|---|---|
| I-JEPA ViT-H/14 | 2406 | 1206 | 644 | 344 | 1230 (256 tok) |
| LeJEPA ViT-S/16 | 83 | 42 | 23 | 13 | 52 (197 tok) |
| LeWM Push-T | 69 | 38 | 23 | 15 | 47 (257 tok) |
| V-JEPA 2 ViT-L SSv2 | 1432 | 717 | 383 | 205 | 808 (2 048 tok) |
| V-JEPA 2 ViT-L fpc64 | 1243 | 622 | 333 | 178 | 1034 (8 192 tok) |
| V-JEPA 2.1 ViT-B/384 | 419 | 210 | 113 | 62 | 948 (18 432 tok) |
| LeVJEPA ViT-L/16 | 1156 | 579 | 310 | 166 | 779 (3 137 tok) |
Weights resident, MiB (jepa_model_n_bytes()); peak RSS additionally covers the graph arena, the
host-side patch buffer and the output rows, so it grows with the token count — linearly, with one
exception. A block_causal file (LeVJEPA) also holds an N × N F16 attention mask, on the host and
in the arena: 39 MiB of the 779 above at 3 137 rows, but 600 MiB at 64 frames (12 545 rows), where
it becomes the largest single allocation in the process. $JEPA_MAX_GRAPH_MIB bounds it and
jepa_encode refuses a clip over that ceiling rather than allocating
(architecture.md). Across these seven
models q8_0 holds 0.53–0.61× the resident f16 weights and q4 0.29–0.40× (LeWM is the high end
of both, because a larger share of its file is the F32 remainder — adaLN, action embedder, position
tables — that no type touches). The clean 0.53× / 0.29× ratios quoted for file sizes, from the 8.5
and 4.5 bits per stored weight, are in quantization.md.
Source: benchmarks.md.
Thread scaling
| model | mode | shape | tokens | ms t=32 | ms t=96 | speedup |
|---|---|---|---|---|---|---|
| I-JEPA ViT-H/14 | encoder | 224² | 256 | 147 | 113 | 1.30× |
| V-JEPA 2 ViT-L SSv2 | encoder | 16 f 256² | 2 048 | 823 | 564 | 1.46× |
| V-JEPA 2 ViT-L SSv2 | head | 16 f 256² | 2 048 | 99.0 | 67.1 | 1.48× |
| V-JEPA 2 ViT-L SSv2 | predictor | 16 f 256² | 2 048 | 341 | 208 | 1.64× |
| V-JEPA 2 ViT-L fpc64 | encoder | 64 f 256² | 8 192 | 6388 | 4027 | 1.59× |
| V-JEPA 2.1 ViT-B/384 | encoder | 384² | 576 | 60.3 | 52.7 | 1.15× |
| V-JEPA 2.1 ViT-B/384 | encoder | 16 f 384² | 4 608 | 853 | 636 | 1.34× |
| V-JEPA 2.1 ViT-B/384 | encoder | 64 f 384² | 18 432 | 9036 | 5040 | 1.79× |
| V-JEPA 2.1 ViT-B/384 | predictor | 16 f 384² | 4 608 | 1304 | 854 | 1.53× |
| LeVJEPA ViT-L/16 | encoder | 16 f 224² | 3 137 | 1480 | 882 | 1.68× |
All rows f16. Tripling the threads never triples the throughput: the 32-thread runs already saturate a good part of the memory bandwidth, and both the LayerNorm/GELU passes and the graph launch overhead scale poorly. The gain is largest where a single matmul or attention tile is big enough to keep 96 workers busy.
Source: benchmarks.md.
Quantization and speed
On the CPU, quantization buys memory, not time. q8_0 lands at 0.93–1.14× of f16, and q4_k is a loss on the wide matmuls: llamafile's accelerated sgemm covers F32, F16 and Q8_0, while the K-quants fall back to ggml's generic vector dot product.
| model | shape | f16 ms | q8_0 ms | q4_0 ms | q4_k ms | f16 MiB | q4 MiB |
|---|---|---|---|---|---|---|---|
| I-JEPA ViT-H/14 | 224² | 147 | 129 | 140 | 198 | 1206 | 344 |
| LeJEPA ViT-S/16 | 224² | 12.8 | 11.3 | 12.0 | 12.9 | 42 | 13 |
| V-JEPA 2 ViT-L fpc64 | 16 f 256² | 821 | 794 | 844 | 1096 | 622 | 178 |
| V-JEPA 2 ViT-L fpc64 | 64 f 256² | 6388 | 6482 | 6616 | 7405 | 622 | 178 |
| V-JEPA 2.1 ViT-B/384 | 384² | 60.3 | 58.5 | 59.7 | 90.7 | 210 | 62 |
| V-JEPA 2.1 ViT-B/384 | 16 f 384² | 853 | 914 | 895 | 1148 | 210 | 62 |
| LeVJEPA ViT-L/16 | 16 f 224² | 1480 | 1508 | 1537 | 1851 | 579 | 166 |
On CUDA the ordering inverts. Every type jepa.cpp ships takes mmq, a real INT8 tensor-core
kernel, so q4_k ties q8_0 and both beat f16 — while also being a quarter and a half of the weight
bytes. q8_0 is the faster of the two on the long clips and q4_k on the short shapes; the two are
within 3 % of each other everywhere both were measured.
| model / shape | f32 | f16 | q8_0 | q4_k | CPU f16 | CPU q4_k |
|---|---|---|---|---|---|---|
| I-JEPA ViT-H, 224² | 11.8 | 15.5 | 8.0 | 7.8 | 147 | 198 |
| V-JEPA 2 ViT-L, 16 f | 44.3 | 46.5 | 34.4 | 34.8 | 821 | 1096 |
| V-JEPA 2 ViT-L, 64 f | 303 | 306 | 281 | 282 | 6388 | 7405 |
| V-JEPA 2.1 ViT-B, 384² | – | 4.4 | – | 3.5 | 60.3 | 90.7 |
| V-JEPA 2.1 ViT-B, 16 f | – | 43.0 | – | 37.3 | 853 | 1148 |
| LeVJEPA ViT-L, 16 f | 85.4 | 87.2 | 70.8 | 71.2 | 1480 | 1851 |
The f32 GPU column is not slower than f16 because ggml's CUDA F32 path is TF32 while the f16 path pays
for GGML_PREC_F32 accumulation. Accuracy per type does not invert with the backend; see
Accuracy → which dtype to ship.
Source: CPU rows from benchmarks.md
and its dtype table; GPU rows from the same jepa-bench --gpu 0 sweep as the GPU encoder table, i.e.
tests/results/benchmarks-gpu.json and
benchmarks.md.
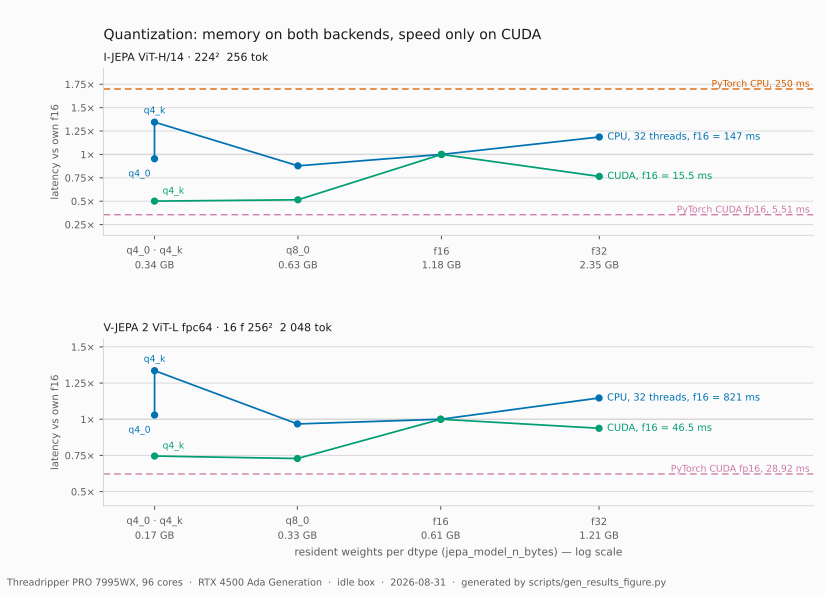
The trade-off per dtype, for the two models measured over the full sweep on both backends: the x
axis is what the file weighs, the y axis is its latency against the same backend's own f16, so a
point below 1× is faster than f16 and a point to the left is smaller.
scripts/gen_results_figure.py --split redraws it.
8-bit inference
The 8-bit format jepa.cpp ships is ggml's q8_0: int8 weights with one f16 scale per block of 32
values. On the CPU the llamafile kernels multiply those int8 weights against f32 activations; on
CUDA mmq quantizes the activations to 8 bits on the fly and runs the dot products on the INT8
tensor cores, so on the GPU q8_0 is 8-bit compute rather than weight-only storage. There is no FP8
path: ggml has no E4M3/E5M2 tensor type at the pinned commit, and no number on this site is an FP8
measurement.
| model | resident weights f16 → q8_0 | CPU ms f16 → q8_0 (32 threads) | CUDA ms f16 → q8_0 |
|---|---|---|---|
| I-JEPA ViT-H/14, 224² | 1206 → 644 MiB (0.53×) | 147 → 129 (0.88×) | 15.5 → 8.0 (0.52×) |
| V-JEPA 2 ViT-L fpc64, 16 f 256² | 622 → 333 MiB (0.54×) | 821 → 794 (0.97×) | 46.5 → 34.4 (0.74×) |
The accuracy side of the same trade is on the Accuracy page: at q8_0 the SSv2 classifier scores 72.47 % top-1 against PyTorch's 72.39 % over the full validation split with 97.97 % of argmaxes identical, the Imagenette k-NN results stay within 0.13 pp, and the UCF-101 predictions are unchanged.
Reproduce
# the whole CPU matrix at 32 threads, then the q4 rows and the 96-thread rows, into tmp/bench/
scripts/bench_all.sh 32
scripts/bench_all.sh 32 --keep --include-quants --only '\-(q4_0|q4_k)$' --modes encoder
scripts/bench_all.sh 96 --keep --only 'ijepa.*-f16|vjepa2-vitl.*-f16|vjepa2_1.*-f16'

# regenerate the raw report and its JSON twin
scripts/gen_benchmarks_md.py --bench-dir tmp/bench --ref-dir tests/fixtures/ref \
    --parity docs/parity.md -o docs/benchmarks.md --results-json tests/results/benchmarks.json

# one CPU configuration by hand
build/jepa-bench -m models/gguf/vjepa2-vitl-fpc64-256-f16.gguf --frames 64 --threads 32,96 --md
bench_all.sh writes one JSON per (file, mode, shape) plus a meta.json; tmp/bench/ is
git-ignored and tests/results/benchmarks.json is the committed twin.
The GPU tables have their own sweep, scripts/bench_gpu.sh, which is the same shape: one
jepa-bench process per configuration into tmp/bench-gpu/, then the same generator, then
tests/results/benchmarks-gpu.json. The configurations are the ones this page tabulates and they
live in scripts/bench_gpu.grid, one line per (model, mode, shape, dtypes), so filling in a cell
printed as – above is a line in that file rather than a new command.
cmake -S . -B build-cuda -G Ninja -DCMAKE_BUILD_TYPE=Release -DJEPA_CUDA=ON && cmake --build build-cuda -j 16

# the PyTorch baseline of the "GPU against PyTorch" table (needs a CUDA-enabled torch)
python scripts/torch_gpu_baseline.py --device 0 -o tmp/bench-gpu/torch-gpu.json

# the whole GPU matrix on device 0, best of 5 after 2 warmups, then the raw report and the artifact
scripts/bench_gpu.sh 0

# one GPU configuration by hand
build-cuda/jepa-bench -m models/gguf/vjepa2-vitl-fpc64-256-q8_0.gguf --frames 64 --gpu 0 \
    --warmup 2 --repeat 5 --md

# either accumulation precision by hand, whatever the family defaults to
build-cuda/jepa-bench -m models/gguf/ijepa_vith14_1k-f16.gguf --gpu 0 --gpu-prec f16 --md

# the parity side of that default, every family and dtype at both settings
scripts/gpu_prec_sweep.sh 1 --timing-repeat 4

# where the GPU time goes, and the attention-tiling and concurrency sweeps
scripts/profile_gpu.py --device 1 -o tests/results/gpu-profile.json

# the predictor and LeWM rows, which are test-predictor on the real fixture clips (docs/parity.md)
build-cuda/test-predictor --vjepa2 models/gguf/vjepa2-vitl-fpc64-256-f16.gguf \
    --ref tests/fixtures/ref/vjepa2-vitl-fpc64-256 --samples archery_f16,bowling_f16 --gpu 0
build-cuda/test-predictor --lewm models/gguf/lewm-pusht-f16.gguf \
    --ref tests/fixtures/ref/lewm-pusht --gpu 0
Rebuilding the document without re-running the card works too: with no --gpu-dir,
gen_benchmarks_md.py renders the GPU tables straight out of the committed artifact.