Accuracy
Fidelity against PyTorch, and task accuracy on real datasets. Every figure on this page is copied from a committed artifact; each section names its source.
Environment
| CPU | AMD Ryzen Threadripper PRO 7995WX, 96 cores / 192 threads, AVX-512 |
| Build | gcc 13.3.0, -O3 -march=native, ggml 36da5713, GGML_LLAMAFILE=ON |
| GPU | NVIDIA RTX 4500 Ada Generation, compute 8.9, 24 GB; CUDA 13.0.88, driver 580.173.02 — device 0 everywhere except the SSv2 validation sweep, which used device 1 |
| Reference | torch 2.13.0+cpu, transformers 5.16.1, float32, 32 threads |
| Reference, SSv2 validation | torch 2.13.0+cu130 on the second RTX 4500 Ada, transformers 5.16.1, float32, TF32 off on matmul and cuDNN |
| Date | 2026-08-31; the SSv2 validation sweep 2026-09-01 |
Two metrics recur. Cosine is per token of last_hidden_state unless a column says otherwise;
cos mean is the worst per-sample mean, cos med the median token, cos min the single worst token
of any sample. rel_max = max|a−b| / max|b| over the compared tensor — the metric that catches a
per-row scale error, which cosine is structurally blind to.
f32 is exact
tests/test-parity against the PyTorch golden dumps, stored reference input, 32 threads, CPU backend,
worst sample per model.
| model | samples | cos mean | worst token | rel_max |
derived tensors |
|---|---|---|---|---|---|
| LeJEPA ViT-S/16 | 8 images | 1.000000 | 1.000000 | 1.2e-05 | cls 1.000000 |
| LeWM ViT-Ti/14 | 2 images + 3-frame sequence | 1.000000 | 1.000000 | 1.0e-06 | emb, emb_seq 1.000000 |
| I-JEPA ViT-H/14 | 8 images | 1.000000 | 1.000000 | 7.9e-05 | pooled_mean 1.000000 |
| V-JEPA 2 ViT-L, 2 048 tok | 2 clips × 16 f | 1.000000 | 0.999999 | 7.5e-04 | pooled_mean 1.000000 |
| V-JEPA 2 ViT-L, 8 192 tok | 2 clips × 64 f | 1.000000 | 0.999990 | 1.2e-03 | pooled_mean 1.000000 |
| V-JEPA 2 ViT-L SSv2 | 2 clips × 16 f | 1.000000 | 0.999999 | 7.5e-04 | logits 1.000000, top-1/top-5 exact |
| V-JEPA 2.1 ViT-B, 4 608 tok | 2 clips × 16 f | 1.000000 | 1.000000 | 8.7e-05 | pooled_mean 1.000000 |
| V-JEPA 2.1 ViT-B, 576 tok | 2 COCO images | 1.000000 | 1.000000 | 6.2e-05 | pooled_mean 1.000000 |
| LeVJEPA ViT-L, 3 137 tok | 2 clips × 16 f + 2 stills | 1.000000 | 1.000000 | 8.3e-06 | cls, pooled_mean 1.000000 |
Predictors at f32 (tests/test-predictor): the V-JEPA 2 ViT-L masked predictor reaches 1.0000000 mean
and worst with rel_max 3.4e-06–3.9e-06 over 2 048 rows; the V-JEPA 2.1 image-modality predictor
1.0000000 with rel_max 7.6e-05; LeWM pred_next and pred_seq 1.0000000 with rel_max 3.5e-07.
So the tubelet patchify, both RoPE table layouts, interpolate_rope, the modality vectors, the image
tokenizer, the prepended CLS token with its identity RoPE row, the block-causal attention mask, the
attentive pooler and the classifier are bit-faithful. Preprocessing is checked
separately and is bit-exact against torchvision's antialiased uint8 resize.
Source: parity.md and parity.md.
f16 and q8_0 on the CPU
| model | ftype | cos mean | cos med | cos min | derived |
|---|---|---|---|---|---|
| LeJEPA ViT-S/16 | f16 | 0.999999 | – | 0.999994 | cls passes the ≥ 0.9995 bar |
| LeJEPA ViT-S/16 | q8_0 | 0.999263 | – | 0.995193 | cls ≥ 0.9997 ᵃ |
| LeWM ViT-Ti/14 | f16 | 1.000000 | – | 1.000000 | emb 1.000000 |
| LeWM ViT-Ti/14 | q8_0 | 0.999913 | – | 0.999895 | emb_seq 0.999895 |
| I-JEPA ViT-H/14 | f16 | 0.999984 | – | 0.997583 | pooled_mean passes the ≥ 0.9995 bar |
| I-JEPA ViT-H/14 | q8_0 | 0.987843 | – | 0.432576 | pooled_mean 0.999748 |
| V-JEPA 2 ViT-L, 2 048 tok | f16 | 0.997144 | 0.999897 | 0.5088 | pooled_mean 0.999991 |
| V-JEPA 2 ViT-L, 2 048 tok | q8_0 | 0.966128 | 0.996770 | 0.2305 | pooled_mean 0.999876 |
| V-JEPA 2 ViT-L SSv2 | f16 | 0.997144 | 0.999897 | 0.5088 | pooled 0.999897, logits 0.999935, top-1/top-5 exact |
| V-JEPA 2 ViT-L SSv2 | q8_0 | 0.966128 | 0.996770 | 0.2305 | pooled 0.996645, logits 0.998501, top-1/top-5 exact |
| V-JEPA 2.1 ViT-B, 4 608 tok | f16 | 0.999952 | 0.999991 | 0.9697 | pooled_mean 1.000000 |
| V-JEPA 2.1 ViT-B, 4 608 tok | q8_0 | 0.999076 | 0.999578 | 0.8302 | pooled_mean 0.999986 |
| LeVJEPA ViT-L, 3 137 tok | f16 | 0.999998 | 0.999999 | 0.999820 | cls 1.000000 |
| LeVJEPA ViT-L, 3 137 tok | q8_0 | 0.999789 | 0.999937 | 0.991409 | cls 0.999989 |
All nine image files and all twenty-five video rows pass their family's thresholds, on the stored input
and on jepa.cpp's own preprocessing alike. The image rows report per-file derived values only where
parity.md lists them individually; where it does not, the cell names the bar the file cleared —
≥ 0.9995 for the image f16 tier.
ᵃ parity.md reports the image q8_0 files together: pooled, cls and emb stay ≥ 0.9997 on every
one of them, with I-JEPA's pooled_mean at 0.999748 and LeWM's emb_seq at 0.999895 the two worst.
V-JEPA 2 ViT-L scatters individual tokens at f16, and the cause is activation rounding. An f16
mul_mat rounds its activations to F16 as well — GGML_LLAMAFILE's AVX-512 kernel has only an
F16×F16 path — so all 24 ViT-L layers carry activations at about three decimal digits, and what that
destroys is a degenerate low-norm token cluster this checkpoint contains. The numpy executable
specification separates the two halves on the same clip, f16 weights throughout:
| ssv2 bowling_f16, f16 weights | mean cos | worst token | tokens < 0.999 |
|---|---|---|---|
| numpy spec, f32 activations | 0.9999968 | 0.999036 | 0 / 2048 |
| numpy spec, F16 activations | 0.9971802 | 0.557581 | 420 / 2048 |
| jepa.cpp f16 | 0.997144 | 0.508778 | 414 / 2048 |
The weights alone cost nothing; the F16 activations cost the whole tail, and jepa.cpp reproduces the
specification's F16-activation run to four digits, on a neighbouring row of the same low-norm cluster.
Flash attention is not involved — --kv-f32 and --no-flash give the same spread (421 and 420 tokens
below 0.999).
Everything downstream is unaffected: at f16 pooled_mean stays at 0.999991, the masked predictor at
0.9999996 and the SSv2 logits at 0.999935 with identical top-1 and top-5. Use f32 for dense
per-token work on that model; f16 is correct everywhere else. V-JEPA 2.1 ViT-B is far more
forgiving — worst token 0.9697 at f16 and 0.8302 at q8_0 — and LeVJEPA has no tail at all: not one of
its 3 137 tokens falls below 0.9998 at f16 on any fixture, because its reference row norms sit in a
narrow band with no low-norm cluster for the rounding to amplify.
The q8_0 rows have a related but distinct cause, and it is spread across the whole network: holding any single matrix family at f16 while quantizing the rest still leaves the ViT-L worst token at 0.29–0.49. The tokens that degrade are the ones with the smallest variance before the final LayerNorm, which divides by that variance and amplifies whatever error the quantized weights injected. Only 0.4 % of I-JEPA's tokens fall below 0.99 at q8_0.
Source: parity.md and quantization.md.
Backends and precision
A CUDA build runs the same graphs, and three backend differences are outside jepa.cpp's control: the
CUDA "F32" matmul is really TF32, CUDA flash attention always converts K/V to F16 and accumulates PV
in half2, and ggml_norm uses a one-pass variance there. There is no f32 tier on a GPU — an f32
GGUF is judged with its family's f16 bars, and test-parity says so in its header. f16 and quantized
files keep their own bars; with GGML_PREC_F32 the f16 matmul term is 2.6e-05, i.e.
better than the CPU's own 3.0e-04.
Encoders on CUDA, worst sample per file, stored-input pass:
| model | ftype | cos mean | cos med | cos min | rel_max |
derived (worst) |
|---|---|---|---|---|---|---|
| LeJEPA ViT-S/16 | f16 | 0.999994 | 0.999996 | 0.9998 | 5.8e-03 | pooled_mean 1.000000 |
| LeJEPA ViT-S/16 | q8_0 | 0.999277 | 0.999426 | 0.9966 | 3.5e-02 | cls 0.999808 |
| LeWM ViT-Ti/14 | f16 | 1.000000 | 1.000000 | 1.0000 | 7.1e-04 | emb 1.000000 |
| LeWM ViT-Ti/14 | q8_0 | 0.999978 | 0.999980 | 0.9999 | 8.9e-03 | emb 0.999923 |
| I-JEPA ViT-H/14 | f16 | 0.999788 | 0.999996 | 0.9613 | 9.1e-02 | pooled_mean 0.999994 |
| I-JEPA ViT-H/14 | q8_0 | 0.990211 | 0.999443 | 0.6453 | 3.8e-01 | pooled_mean 0.999725 |
| V-JEPA 2 ViT-L fpc64, 8 192 tok | f16 | 0.994793 | 0.999696 | 0.3557 | 4.7e-01 | pooled_mean 0.999984 |
| V-JEPA 2 ViT-L fpc64, 8 192 tok | q8_0 | 0.967114 | 0.996680 | 0.1938 | 6.5e-01 | pooled_mean 0.999889 |
| V-JEPA 2 ViT-L SSv2 | f16 | 0.997052 | 0.999870 | 0.4352 | 3.6e-01 | pooled 0.999899 |
| V-JEPA 2 ViT-L SSv2 | q8_0 | 0.967114 | 0.997084 | 0.1938 | 6.5e-01 | pooled 0.996336 |
| V-JEPA 2.1 ViT-B/384, 4 608 tok | f16 | 0.999951 | 0.999985 | 0.9769 | 5.1e-02 | pooled_mean 0.999999 |
| V-JEPA 2.1 ViT-B/384, 4 608 tok | q8_0 | 0.999073 | 0.999568 | 0.8396 | 1.3e-01 | pooled_mean 0.999983 |
| LeVJEPA ViT-L/16, 3 137 tok | f16 | 0.999996 | 0.999998 | 0.9999 | 4.1e-03 | cls 0.999999 |
| LeVJEPA ViT-L/16, 3 137 tok | q8_0 | 0.999785 | 0.999864 | 0.9914 | 2.3e-02 | pooled_mean 0.999982 |
27 of the 29 encoder files pass, and all 9 predictor rows do. The two that do not —
lejepa-vits16-q4_k (derived cls 0.9851 against the low-bit tier's 0.99) and
vjepa2-vitl-fpc16-256-ssv2-q4_k (logits 0.9781, pooled 0.9807) — fail identically on the CPU: q4_k
is below 8 bits per weight and is not a parity configuration for those two models. Every other q4_k
row passes on the GPU, which matters because q4_k is the fastest GPU path there. The classifier
reproduces the reference top-1 and top-5 exactly at f32, f16 and q8_0.
Two properties of this table are worth stating plainly.
- I-JEPA ViT-H's worst token is the outlier: 0.9976 on the CPU at f16 against 0.9613 on a GPU
(0.9723 with
--no-flash, i.e. an F32 attention path). It is the F16 PV accumulator plus TF32 landing on one high-norm row — reference row norm 39.23 against a 32.85 mean. LeJEPA and LeWM stay at 0.9998 and 0.99999 on the same backend, and I-JEPA's median stays at 0.999996. The image-family worst-token and mean bars are correspondingly looser on the GPU than on the CPU. - The V-JEPA 2 ViT-L f32 file on CUDA behaves like its f16 file: worst token 0.3549 against 0.3557, where on the CPU the same f32 file is exact. That is the "no f32 tier" statement measured end to end.
- LeVJEPA is the one family whose GPU rows read better than its CPU ones at f32/f16 — worst token 0.9999 against 0.99982 — and the one place a backend difference is visible at q4_k: 0.8844 on the GPU against 0.9575 on the CPU, with the CLS feature still at 0.9993. Its block-causal mask is the first the CUDA flash kernel has run here, and it needs no padding at this ggml commit: the MMA kernel wraps mask rows and clamps the key axis of its final tile.
Predictors on CUDA take the naive attention path at head_dim 32 and are more accurate than a flash
kernel would be — genuinely F32 end to end, rel_max 1.7e-03–2.8e-03 against the PyTorch dump, the
same order as the CPU's 1.3e-03–1.7e-03. LeWM's structural self-consistency checks (causal-prefix
equality, rollout against predict) are bit-identical on the GPU at all three dtypes.
Source: parity.md and
parity.md, GGML_PREC_F32 on every mul_mat.
Imagenette k-NN
10 ImageNet classes, frozen features, k = 20 cosine k-NN plus a nearest-centroid vote. Nothing is
trained — the encoders are used exactly as shipped and the "classifier" is a similarity vote over
gallery features. jepa.cpp decodes the JPEGs itself with stb_image, so this is the real input path
rather than a fixture replay.
| model | backend | dtype | kNN top-1 % | centroid top-1 % | agreement % | mean feat cos |
|---|---|---|---|---|---|---|
| I-JEPA ViT-H/14, 3 925 queries, gallery 2 000 | PyTorch | f32 | 95.36 | 92.25 | — | 1 |
| jepa.cpp | f16 | 95.31 | 92.25 | 99.82 | 0.999944 | |
| jepa.cpp | q8_0 | 95.31 | 92.31 | 99.75 | 0.999774 | |
| jepa.cpp | q4_k | 95.08 | 92.25 | 99.11 | 0.995049 | |
LeJEPA ViT-S/16 (cls), gallery 9 469 |
PyTorch | f32 | 94.45 | 87.59 | — | 1 |
| jepa.cpp | f32 | 94.52 | 87.64 | 99.85 | 0.999983 | |
| jepa.cpp | f16 | 94.55 | 87.64 | 99.82 | 0.999983 | |
| jepa.cpp | q8_0 | 94.50 | 87.64 | 99.87 | 0.999843 | |
| jepa.cpp | q4_k | 94.22 | 87.67 | 99.08 | 0.988725 |
Over those two models and both LeJEPA features — ten comparisons — no jepa.cpp k-NN row is further
than 0.28 pp from its PyTorch row, and none further than 0.13 pp at f32, f16 or q8_0
(worst cases: q4_k 0.2803 pp on I-JEPA, q8_0 0.1274 pp on LeJEPA cls). On the parameter-free
centroid metric the same rows stay within 0.16 pp (q8_0 0.1529 pp on LeJEPA mean).
The f32 row is not at 100 % agreement because stb_image and PIL/libjpeg differ by ±1–2 levels on
about 2 % of pixels. That decoder floor, 1 − cos of 6.3e-6 to 1.7e-5, is larger than what f16 adds,
which is why the f32 and f16 rows are indistinguishable from each other.
Source: accuracy-image.md, 32 threads, PyTorch and jepa.cpp passes
alternated inside one 87-minute sweep on an idle box. Machine-readable twin:
tests/results/accuracy-image.json.
UCF-101 k-NN
10 classes, gallery 300 clips, 105 val+test query clips, 16 frames per clip decoded once with PyAV and read by both backends, so they see identical pixels. Same protocol: frozen features — the token mean, or the CLS token for LeVJEPA — with a k = 20 cosine k-NN and a nearest-centroid vote.
| model | backend | dtype | kNN top-1 % | centroid top-1 % | kNN agree % | centroid agree % | feat cos |
|---|---|---|---|---|---|---|---|
| V-JEPA 2 ViT-L fpc64 | PyTorch | f32 | 88.6 | 95.2 | — | — | — |
| jepa.cpp | f16 | 89.5 | 95.2 | 99.0 | 100.0 | 0.999996 | |
| jepa.cpp | q8_0 | 89.5 | 95.2 | 99.0 | 100.0 | 0.999886 | |
| V-JEPA 2.1 ViT-B/384 | PyTorch | f32 | 88.6 | 86.7 | — | — | — |
| jepa.cpp | f32 | 88.6 | 86.7 | 100.0 | 100.0 | 1.000000 | |
| jepa.cpp | f16 | 89.5 | 86.7 | 99.0 | 100.0 | 1.000000 | |
| jepa.cpp | q8_0 | 89.5 | 86.7 | 99.0 | 100.0 | 0.999988 | |
LeVJEPA ViT-L/16 (cls) |
PyTorch | f32 | 81.9 | 81.0 | — | — | — |
| jepa.cpp | f32 | 81.9 | 81.0 | 100.0 | 100.0 | 1.000000 | |
| jepa.cpp | f16 | 81.9 | 81.0 | 100.0 | 100.0 | 1.000000 | |
| jepa.cpp | q8_0 | 81.9 | 81.0 | 100.0 | 100.0 | 0.999995 |
Where a jepa.cpp row reads higher than PyTorch — 89.5 against 88.6 % — that is one clip out of 105. LeVJEPA reproduces every single prediction at every dtype, k-NN and centroid alike, which is the only model here for which that holds down to q8_0.
Every k-NN disagreement is a tie in the neighbour set: the two backends agree on 19 of the 20 nearest gallery clips and the 20th and 21st are separated by less cosine than the two backends' similarities to the query differ by, so which one lands inside the neighbourhood is decided by round-off. The parameter-free metric confirms it — nearest-centroid agreement is 100 % for every model and every dtype. Over all 405 clips the worst single clip at any dtype still matches PyTorch to cosine 0.999643.
Feature fidelity over all 405 clips: V-JEPA 2.1 ViT-B at f32 reaches mean cosine 1.0000000 with the largest single-component difference at 7.13e-05; at f16 0.9999999; at q8_0 0.9999874. V-JEPA 2 ViT-L reaches 0.9999946 at f16 and 0.9998754 at q8_0. LeVJEPA reaches 1.0000000 at f32 (worst clip 1.0000000, largest component difference 1.72e-05) and f16, and 0.9999943 at q8_0 (worst clip 0.9999677).
Source: accuracy-video.md, 32 threads, PyTorch and jepa.cpp stages alternated in
one sweep on an idle box. Machine-readable twin: tests/results/accuracy-video.json.
SSv2 validation top-1
The SSv2 classifier scored on the task it was trained for: all 24 777 clips of the
Something-Something-v2 validation split, 174 classes, one view per clip and no test-time
augmentation. Sixteen frames sampled uniformly over the whole clip
(idx = round(linspace(0, T − 1, 16)) over every decoded frame), shortest edge to 292 with bilinear
resampling, centre crop 256, the checkpoint's own mean and standard deviation. Both engines read the
same THWC uint8 frames and each runs that pipeline itself, so the rows differ only in the engine and
the weight dtype. Every clip decoded; none was skipped. The reference is transformers
VJEPA2ForVideoClassification in float32 on the second RTX 4500 Ada (cuda:1), TF32 disabled on
both matmul and cuDNN, four clips per forward. The processor is batch-invariant; the model forward
is not quite — a different batch size moves a logit by ~2e-04 and no argmax with it — so the batch
size is part of the protocol.
| backend | dtype | top-1 % | top-5 % | Δ top-1 vs PyTorch | top-1 agreement % | logit cos, mean / worst clip |
|---|---|---|---|---|---|---|
| PyTorch | f32 | 72.39 | 94.11 | — | — | — |
| jepa.cpp CUDA | f32 | 72.39 | 94.10 | +1 clip | 99.66 | 0.999963 / 0.9859 |
| jepa.cpp CUDA | f16 | 72.39 | 94.11 | +1 clip | 99.66 | 0.999963 / 0.9856 |
| jepa.cpp CUDA | q8_0 | 72.47 | 94.07 | +19 clips | 97.97 | 0.999172 / 0.9419 |
| jepa.cpp CUDA | q4_k | 72.52 | 94.02 | +32 clips | 94.19 | 0.993067 / 0.7948 |
f16 is the PyTorch number. Over 24 777 independent 174-way argmaxes the f16 file lands one clip from the reference on top-1 and lands on the same 94.11 % top-5 rate, at 717 MiB of resident weights against the f32 file's 1 432. The rates match; the decisions behind them do not quite. The two 72.39 % rows land on a different answer for 85 clips, 55 of which change from right to wrong or back — 28 gained against 27 lost, which is where the one-clip margin comes from — and the identical top-5 rate is a wash of 8 hits gained against 8 lost. The f32 GGUF behaves like the f16 one on a GPU, which is the "no f32 tier on CUDA" rule measured end to end rather than asserted.
Quantization moves decisions without moving the score. q8_0 disagrees with PyTorch on 502 clips and q4_k on 1 439, yet both land within 0.13 pp of it on top-1 and give up at most 0.09 pp of top-5. Those top-1 deltas are +19 and +32 clips out of 24 777 and they happen to fall on the useful side; a re-quantization would be as likely to lose them. Read the agreement and top-5 columns, not the top-1 delta, as the cost of a low-bit file: what quantization buys is 383 and 205 MiB of weights against f16's 717, and what it costs is that 2.0 % (q8_0) and 5.8 % (q4_k) of top-1 decisions are no longer the reference's. f16 stays the recommendation for classifier work — now with the size of the accuracy risk measured rather than inferred from the agreement column.
CPU, and the f32 anchor
The CPU rows run on a fixed subset — every 10th clip of the validation order, 2 478 clips — with the CUDA and PyTorch rows scored on the same clips so the columns compare directly.
| backend | dtype | top-1 % | top-5 % | top-1 agreement with PyTorch % | logit cos, mean / worst clip |
|---|---|---|---|---|---|
| PyTorch | f32 | 72.84 | 94.35 | — | — |
| jepa.cpp CPU, 32 threads | f32 | 72.84 | 94.35 | 100.00 | 1.0000000 / 0.99999997 |
| jepa.cpp CPU, 32 threads | f16 | 72.92 | 94.39 | 99.72 | 0.999973 / 0.9974 |
| jepa.cpp CUDA | f16 | 72.92 | 94.27 | 99.68 | 0.999965 / 0.9980 |
On the CPU at f32 every one of the 2 478 argmaxes is PyTorch's, the mean per-clip logit cosine is 1.0000000 to seven places, the worst clip is 0.99999997, and the largest single logit differs by 2.6e-03. Read against each other rather than against PyTorch, the CPU and CUDA f16 runs of the same GGUF agree on 99.96 % of clips (one of 2 478); the same comparison for the f32 GGUF drops to 99.76 %, because on the CPU that file is exact and on a GPU it is not.
The exactness claim is anchored on a third run — transformers itself on the CPU at f32, over
every 100th clip (248) — because that is the only comparison in which both sides do the same
arithmetic on the same hardware:
| run against PyTorch CPU f32, 248 clips | argmax agreement % | mean 1 − cos | worst clip 1 − cos | max abs logit diff |
|---|---|---|---|---|
| jepa.cpp CPU f32 | 100.00 | 1.0e-10 | 1.1e-08 | 8.0e-04 |
| jepa.cpp CPU f16 | 100.00 | 2.5e-05 | 4.2e-04 | 4.0e-01 |
| PyTorch CUDA f32 (control) | 100.00 | 7.5e-11 | 1.7e-09 | 4.7e-04 |
The control row is what gives the first one a scale: jepa.cpp's f32 CPU logits sit the same distance from PyTorch's CPU logits as PyTorch's own fp32 CUDA logits do — 1e-10 in cosine, 1e-04 in the largest single logit — over a full encoder, attentive pooler and 174-way classifier.
The gap to the published number
The published figure for this architecture is 73.7 % (V-JEPA 2, arXiv:2506.09985, Table 4, ViT-L on SSv2), measured with 16 × 2 × 3 inputs — two temporal crops × three spatial crops, logits averaged over the six clips. This page's figure is one clip and one crop. The engine is not what separates them — PyTorch itself scores 72.39 % under this protocol — but nothing here runs the multi-view protocol, and the decoder and the probe of the published run are not held fixed either, so the 1.3 pp is left unattributed. The released checkpoint's model card publishes no number of its own.
Source: accuracy-video.md, 2026-09-01.
Machine-readable twin: tests/results/accuracy-ssv2.json, which carries the clip order, the true
labels and every run's per-clip top-1 prediction.
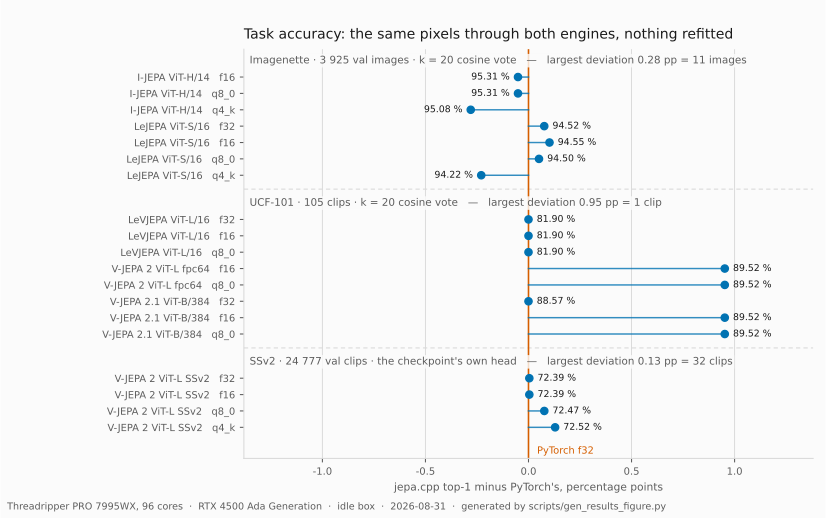
All three benchmarks on one scale: the line is PyTorch's own top-1 and each dot is a jepa.cpp file
against it, labelled with its absolute top-1. scripts/gen_results_figure.py --split redraws it.
SSv2 head agreement on out-of-distribution clips
The 105 UCF-101 query clips through encoder + attentive pooler + 174-way classifier, scored as agreement with PyTorch's argmax. SSv2 labels are meaningless on UCF clips, so this is a backend-fidelity measurement on video the classifier has never been trained for — the task accuracy is the section above, on SSv2's own validation split.
| dtype | top-1 agreement % | top-5 overlap % | PyTorch top-1 inside jepa.cpp's top-5 % | max abs logit diff | logit cos |
|---|---|---|---|---|---|
| f16 | 99.0 | 99.4 | 100.0 | 0.1885 | 0.999970 |
| q8_0 | 94.3 | 97.0 | 100.0 | 1.0421 | 0.998922 |
An argmax over 174 classes has no averaging to hide behind, unlike a pooled 1024-vector whose cosine stays at 0.9999. q8_0 moves 6 of these 105 top-1 decisions while the PyTorch top-1 stays inside jepa.cpp's top-5 on 100 % of clips, so the ranking is intact and only near-ties at the top move. The 24 777-clip SSv2 run above puts the same effect on a scale that resolves it: 2.0 % of argmaxes move at q8_0, and the top-1 score moves by 0.08 pp.
Source: accuracy-video.md.
Which dtype to ship
| use | CPU | CUDA | evidence |
|---|---|---|---|
| default deployment | f16 | f16 | pooled, CLS and logit outputs ≥ 0.9998 on every model; 0.5× f32 |
| pooled features, retrieval, k-NN, LeWM rollouts | q8_0 | q8_0 | engine-measured pooled cosine ≥ 0.9997 for the mean-pooled features and 0.9966 for the SSv2 attentive pooler; 0.53–0.61× the resident f16 weights; within 0.13 pp (k-NN) and 0.16 pp (centroid) of PyTorch on Imagenette and within one clip on UCF-101 |
| classification with the attentive-pool head | f16 | f16 | on the full SSv2 validation split f16 reaches PyTorch's 72.39 % top-1 to within one clip of 24 777 and reproduces its 94.11 % top-5 exactly, with 99.66 % of argmaxes identical; q8_0 keeps the score (72.47 %) but moves 2.0 % of the argmaxes, q4_k 5.8 % |
| dense per-token features | f32 for V-JEPA 2 ViT-L, q8_0 elsewhere | not available — use the CPU | that checkpoint's worst token is 0.51 at f16 and 0.23 at q8_0 while its pooled_mean stays ≥ 0.9998; a GPU has no f32 tier |
| smallest footprint, pooled ≈ 0.99 is enough | q4_k, advisory | q4_k, advisory and the fastest path there | 0.29–0.40× the resident f16 weights; pooled cosine 0.992–0.998 in the weight-only study and 0.978–0.998 through the engine, the SSv2 pooler at 0.9807 and its logits at 0.9781 being the two that miss the advisory bar; test-parity reports but does not gate files below 8 bits per weight. On the SSv2 validation split the same file still scores 72.52 % top-1 against PyTorch's 72.39 %, with 5.8 % of argmaxes moved |
The accuracy column of this table does not change with the backend; the speed column does. On the
CPU q4_k is the slowest type; on CUDA it ties q8_0 and beats f16 (see
Performance → quantization and speed). Two q4_k files miss
even the advisory bar on both backends: lejepa-vits16-q4_k and vjepa2-vitl-fpc16-256-ssv2-q4_k.
Pooling hundreds of tokens averages quantization noise away, which is why q4_k still lands within 0.28 pp on Imagenette while individual tokens of the same file are visibly worse.
Source: quantization.md for the weight-only study (GGUF dequantized in Python and pushed through the numpy reference graph), refined by parity.md at the engine level and confirmed by both k-NN benchmarks above.
Reproduce
# per-file parity against the golden dumps, CPU then GPU
build/test-parity models/gguf/<model>.gguf tests/fixtures/ref/<ref> --threads 32 [--json out.json]
build-cuda/test-parity models/gguf/<model>.gguf tests/fixtures/ref/<ref> --gpu 0
build/test-predictor --vjepa2 models/gguf/<model>.gguf --ref tests/fixtures/ref/<ref> --threads 32

# the dataset benchmarks (datasets first: scripts/download_datasets.sh, ~400 MB into data/)
.venv/bin/python scripts/bench_accuracy_image.py all --out-json tests/results/accuracy-image.json
.venv/bin/python scripts/bench_accuracy_video.py all --out-json tests/results/accuracy-video.json \
    --out-md docs/accuracy-video.md
scripts/render_accuracy_md.py --write docs/accuracy-image.md

# SSv2 validation accuracy (needs the licence-gated dataset in data/ssv2 and a CUDA torch venv;
# the ~114 GB frame cache is deleted once the sweep is done)
S="tmp/venv-cuda/bin/python scripts/bench_accuracy_ssv2.py"
.venv/bin/python scripts/bench_accuracy_ssv2.py frames --jobs 48
.venv/bin/python scripts/bench_accuracy_ssv2.py lists
$S torch --device cuda:1 --batch 4 --threads 8           # the fp32 reference, 24 777 clips
$S cpp   --dtype f16  --device cuda:1                    # then q8_0, q4_k, f32
$S cpp   --dtype f16  --device cpu --scope sub10         # then f32, 2 478 clips at 32 threads
OMP_NUM_THREADS=32 .venv/bin/python scripts/bench_accuracy_ssv2.py \
    torch --device cpu --scope sub100 --batch 1          # the CPU-against-CPU f32 anchor
$S report --out-json tests/results/accuracy-ssv2.json
.venv/bin/python scripts/bench_accuracy_video.py report \
    --out-json tests/results/accuracy-video.json --out-md docs/accuracy-video.md

# weight-only quantization accuracy, no C++ graph involved
.venv/bin/python scripts/gguf_dequant_selftest.py --gguf models/gguf/<model>-q8_0.gguf \
    --ref tests/fixtures/ref/<model> --threads 32
Both report stages are idempotent and survive the deletion of their frame caches: re-running the
last two commands on a checkout with no decoded frames rewrites
tests/results/accuracy-{video,ssv2}.json and docs/accuracy-video.md byte for byte, because
each carries the decode count, the decode wall time and the frame manifest forward from the artifact
it is overwriting. That is the check to run after editing either generator.